CONTROL of MATERIAL PROPERIES METHODS
HEAT TREATMENT PROCESS :
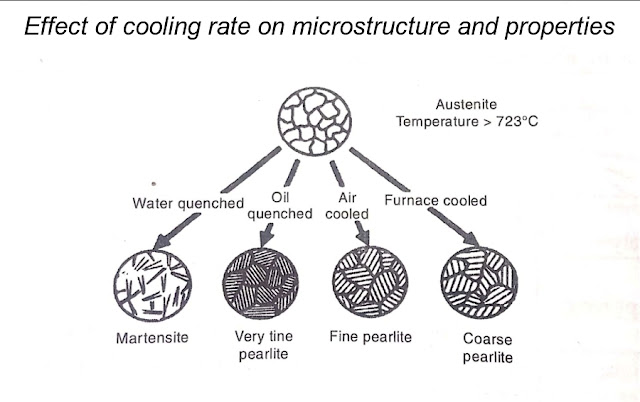
Control of material properties can also be achieved without the addition of other elements.This is done by subjecting the material to a controlled cycle of heating and cooling. Take a simple example where austenite steel (above 723°C) is cooled at different rates.The various resulting structures along with a few mechanical properties.
Obviously by changing only the rate of cooling, different phases can be achieved.The
Information on the change of phase with the cooling rate can be conveniently displayed with the help of a tume-tempreture-transfor
-mation diagram (commonly known as the TTT diagram).In such a diagram,the tempera
-ture is plotted along the vertical axis (using a linear scale),where as the abscissa representsthe time on a logarithmic scale. The TTT diagram for carbon steel is given in.
When austenite is brought to a temperature A1 from A0 (in essentially zero time) and thereafter held at A1, the transformation to pearlite begins after a lapse of time t1 , as M in the figure.Such a transformation, taking place at a constant temperature,is known as an isothermal transformation.The point N indicates a time t2 after which the transfor-
-mation is complete.
The transformations corresponding to other temperature,A2 and A3, are also shown.At about 600°C,the transformation starts after a minimum lapse of time,and this part of the diagram is called the nose.Below this temperature,austenite transforms into bainite which is an intimate mixture of ferrite and cementite (cementite exists in the form of tiny spheroids).Bainite cannot be produced by continuous cooling.
When the temperature of isothermal transformation is decreased (above 600℃),
the time required for the transformation reduces.This results in a finer grain structure
as less time is available for the growth of new nuclei.
The curve, indicating the beginning of the transformation,does not exist below about 220℃. Below this temperature,austen-
-ite instantaneously starts transforming into
martensite.
It imparts high mechanical properties to steels.
Time Temperature Transformation
(TTT) Diagram :
Prof.Bain heated the steel samples having an eutectoid composition at a temper
-ature at which austenite is stable.These samples are subsequently quenched to different temperatures below 725℃. The first
sample was quenched to 700℃ and it was observed that for a substantial period of time
there was no change in the micro structure of 'austenite'.Although austenite cannot be
stable below 725℃, this period is called incubation period.Decreasing quenching temperature, incubation period decrease and
at 550℃ it is only 'one second' decreasing quenching temperature further,again there is increase in the incubation period.
On projecting percentage decomposition
vs time graph to temperature vs time graphs
two 'C' curves appears.This diagram is called
Time-Temperature-Transformation curve or
TTT or C- curve or S-curve or Bains curve.
..................Thank You......................
Fiza Engineer ...........Sk Najmul


0 comments:
Post a Comment
Please do not enter any spam link in the comment box.